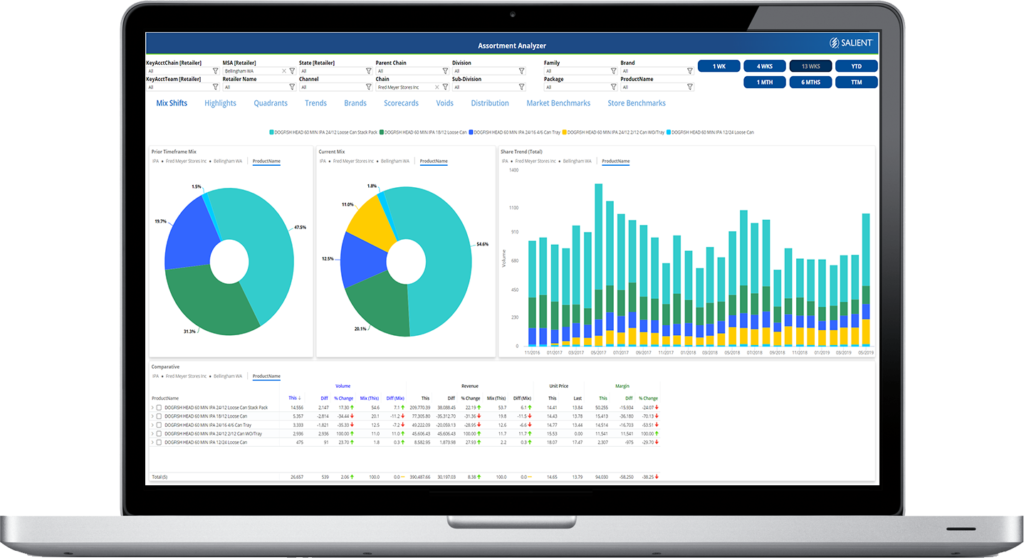
Assortment Analyzer
Our Assortment Analyzer application includes templates to help improve product mixes to best match consumer demands and shifting market behaviors down to individual store locations. Use Assortment Analyzer to easily see which products are contributing to overall category growth. Measure market penetration, trial, and retrial of new products. See the effect new products have on existing product lines, and track their overall adoption rates. Best practice templates include:
- Growth and Cannibalization
- Revenue Percent Contribution by SKU
- Assortment Growth vs. Benchmarks
- Basket Size Effectiveness
- New Item Adoption & Business Impacts
- Top Seller Potential Voids
- Product Lifecycle
New Product Execution / Penetration and Retrial
Identify New Product Execution and Product Lifecycle
- How quickly did we get the product to market?
- What’s the rate of re-trial or stickiness(blue line)?
- What % of Customers have tried the product at least once (black line)?
- Who tried once but didn’t re-buy (the space between the black line and the blue line)?
Consider using our pre-built exception tests to isolate new products automatically.
Mix over Time & Cannibalization Analysis
Measure the % contribution of each product over time to judge the impact of new products and product mix changes on any category or product group.
- Lasso multiple timeframes to compare the mix, total and average sales for different timeframes.
- Easily identify which product assortment yielded the best results.
- Pick any timeframe, any metric, and any product group ad hoc
- Visualize and monitor cannibalization over time.
Voids Identification – Crosstab
The Crosstab is perfect for ‘spotting holes,’ affectionately called the Swiss Cheese view.
- Sub-Grouping is supported
- Two time-frames are supported
- Multiple metrics at once are supported
Pick any chain or customer group and product group combination ad-hoc to identify potential voids and cross-selling opportunities.