Operational Efficiency
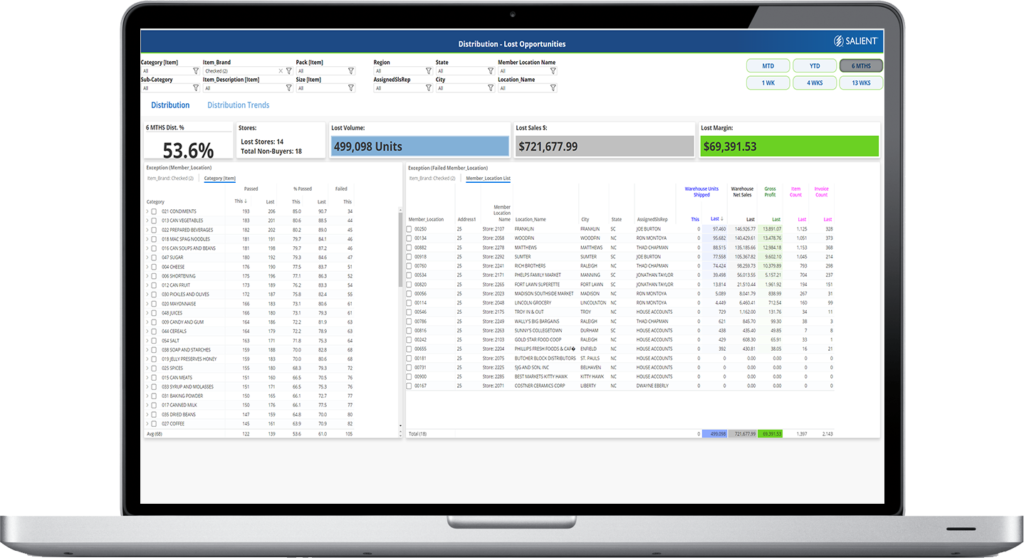
Salient’s Operations Application helps identify potential distribution, supplier, or store-level execution issues. Users can adjust their focus to look at various aggregate levels by customer and product (such as by Channel, Market Area, Chain, Banner, Supplier, Brand, Package, or SKU) to determine the frequency and value of potential order shorts or out-of-stocks. Templates include:
- Distribution & Lost Opportunities
- Points of Distribution & Placement Churn
- Fill Rate & On-Time In-Full Performance
- Sell-in vs. Sell-Out Effectiveness
- Store Sell-Through Performance
- Out-of-Stock Events
Distribution Trend
Identify New Product Execution and Product Lifecycle
- How quickly did we get the product to market?
- What’s the rate of re-trial or stickiness(blue line)?
- What % of Customers have tried the product at least once (black line)?
- Who tried once but didn’t re-buy (the space between the black line and the blue line)?
Consider using our pre-built exception tests to isolate new products automatically.
% Distribution / Market Saturation Analysis
Of all the customers allowed to buy or in our target list, how many are buying vs are not (buy vs non-buy).
- Easily jump to non-buy target list by toggling to grid view and double-clicking any non-buyer cell in the table.
- Easily export to Excel or share a target list via a link.
- Pick the area you are responsible for or any product and customer group.
- Easily add a second timeframe like prior year or the prior 90 days to show gains or losses in distribution.
- Re-group and change timeframes ad hoc.
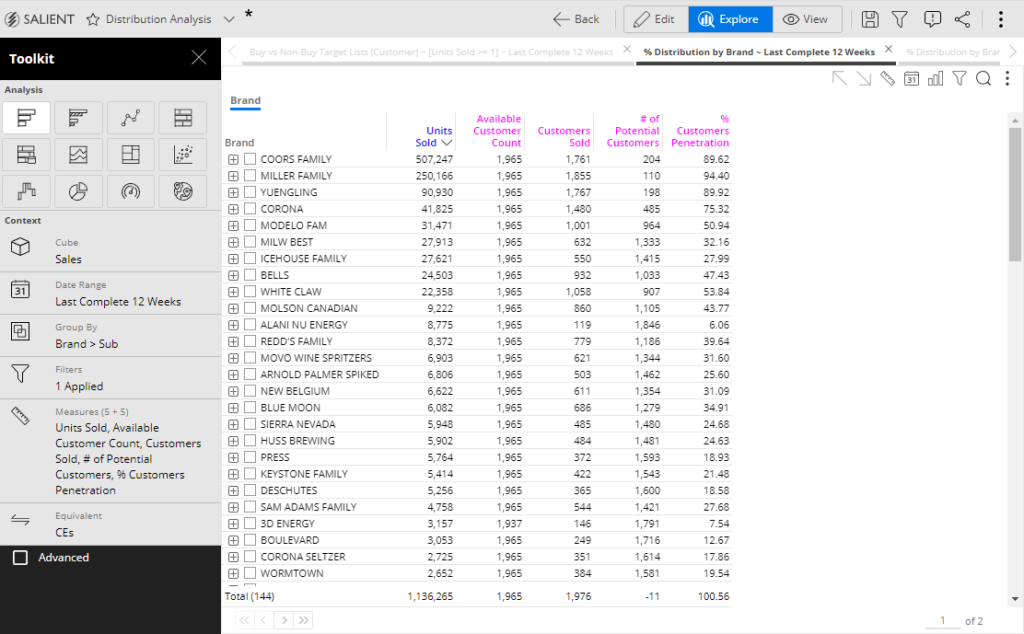
% Distribution Based on Custom Rules
The Comparative Analysis can factor in criteria or rules like ‘authorized items’ and make spotting opportunities much easier.
In this example, we are measuring % product penetration. Pick any channel, chain or customer group to measure and improve.
- Double-click any row to drill-down
- Use the underlined heading to re-group
- Use the ruler symbol to switch metrics
- Use the calendar symbol to pick any timeframe
Lost Placements
Automatically Identify Lost Placements
This analysis helps you easily identify which customers to prioritize and regain distribution where products had previously been purchased.
Templates provide visibility into ‘New Placements’ as well via another exception test pre-built for you.
- Dynamic Time Frame Selection
- Customize the Exception Rule
- Push out with notifications or scheduled reports
Voids Identification – Crosstab
The Crosstab is perfect for ‘spotting holes,’ affectionately called the Swiss Cheese view.
- Sub-Grouping is supported
- Two time-frames are supported
- Multiple metrics at once are supported
Pick any chain or customer group and product group combination ad-hoc to identify potential voids and cross-selling opportunities.