Price Optimization
Our Price Optimization application includes our industry best practice templates for measuring and improving pricing effectiveness. Each template leverages the full root-cause analysis capabilities of our Salient Explorer platform.
Salient Price Optimization Includes:
- Range Effectiveness
- Trends Analysis
- Price Change Impacts
- Elasticity Comparison
- Customer Performance Quadrants
- Competitor Pricing (when market data is added)
- Benchmark Comparisons
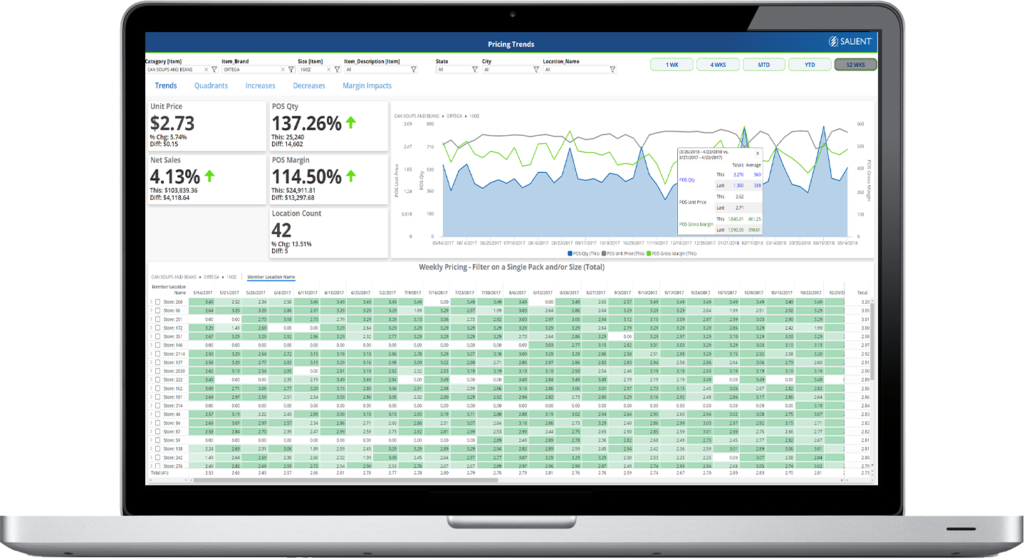
Trend Analysis
Identify pre, during & post change impacts
The Salient trend analysis has pre-programmed hot spots to lasso periods on the chart to provide popups indicating totals and averages per week so the impact of price changes, promotions, plan-o-gram resets or other decisions can be very easily measured and annotated.
End users can tailor the metrics to the situation, filtering on any area of the business and rubber-band pre vs post change impacts very easily.
Scattergram / Scatter Plot Analysis
Scattergram Outlier Identification
This analysis isn’t just a chart of a scattergram. Selecting members will display a list that becomes a new starting-point for investigation. Users can continue further and drill down into the resulting list. They can even choose the Explore option to take the outliers and trend them out, compare their numbers vs. another time period, or regroup the data, etc. to identify drivers of those outliers.
Elasticity
Elasticity of Demand
Many advanced calculations can be performed directly within Salient and the results provide extremely fast re-calculating as you filter on a chain, channel, brand or timeframe to evaluate scenarios like how elastic pricing is in certain market segments.